A Golden New Year?
As always, what we like most about Ben’s median line analysis is his comparison of the precious metals to various currencies, not just one, as well as differing timeframes. Will 2018 be a golden new year? Take a few moments to review the following analysis and decide for yourself.
We use Median Line analysis to put a framework around the way that price moves. By not thinking on the horizontal but instead in terms of the path of price we are able to establish lines of Support and Resistance that few other traders or investors are aware of. Median Lines give context to what would otherwise be chaotic price action – they bring order and a pattern – and because our brains are hard-wired to look for patterns we feel comfortable with what they show. Furthermore when a chart makes sense to you it becomes far easier to trade it with confidence….
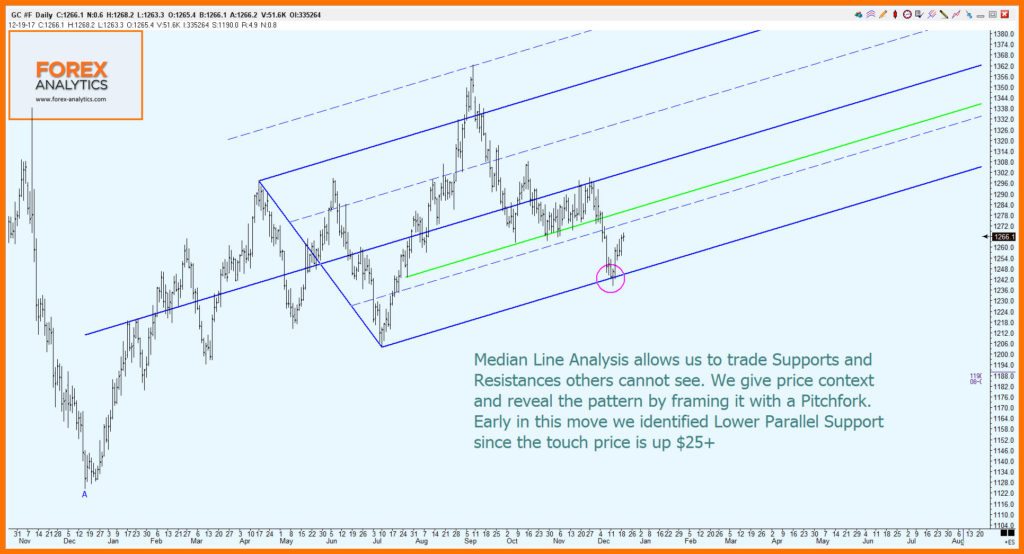
So bearing that in mind, let’s have a look at Chart 1 which shows Gold in USD on a Daily timeframe. Once we had the structure of the pitchfork in place it was a matter of waiting for confirmation of the circled Lower Parallel providing Support. Price did move fractionally beneath its intraday, but the bar closed high and we have since seen a move of about $25 away from that level. We’re bullish Gold as long as price remains above the Lower Parallel Support which is currently at $1245.
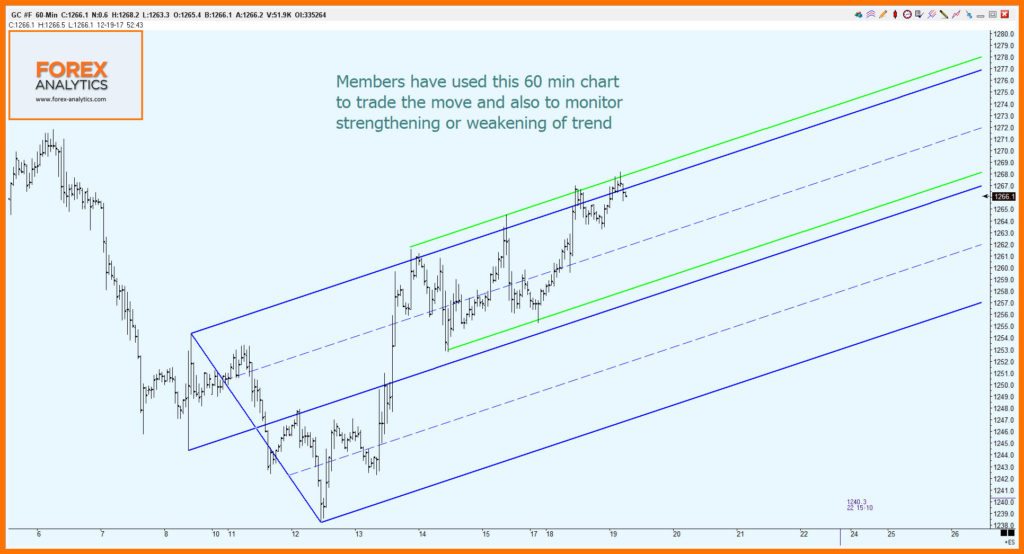
Median Line Analysis is very effective across all timeframes – Chart 2 shows Gold on a 60 minute basis and this is something that our members have been following since the low was put in. By establishing the Path of Price ie the angle in which price is moving, we have been able to trade price to Resistance. In this case it was the anticipated reactions from the constant line of the higher green Sliding Parallel. Not being greedy and knowing your Supports and Resistances are huge advantages for a trader or investor.
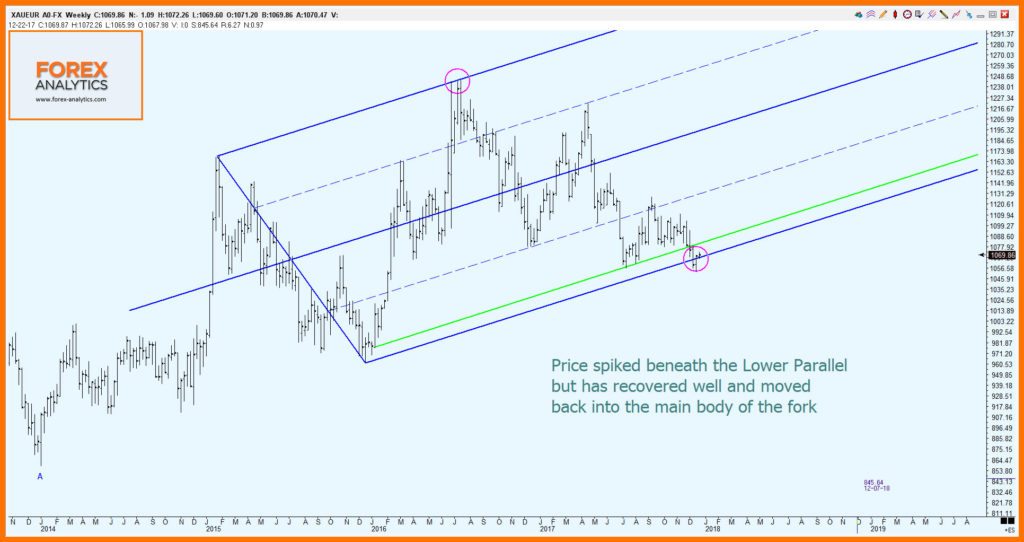
At Forex Analytics we don’t only monitor Gold and Silver in USD. There is a big world out there and the dollar price is only one of many that are attached to the Precious Metals. By looking at the metals through a “different lens” one can expect to gain a better understanding of how things stand globally. Chart 3 shows Gold in EUR on a Weekly basis and is not dissimilar to the Daily Gold chart in USD shown above. The pitchfork has almost perfectly captured the moves in price from the repeated Resistance at €1246 to the anticipated Support at the Lower Parallel at €1065. Admittedly, we did have a slight spike below Support but price rapidly regained the Lower Parallel and we will now look for that Support to be maintained.
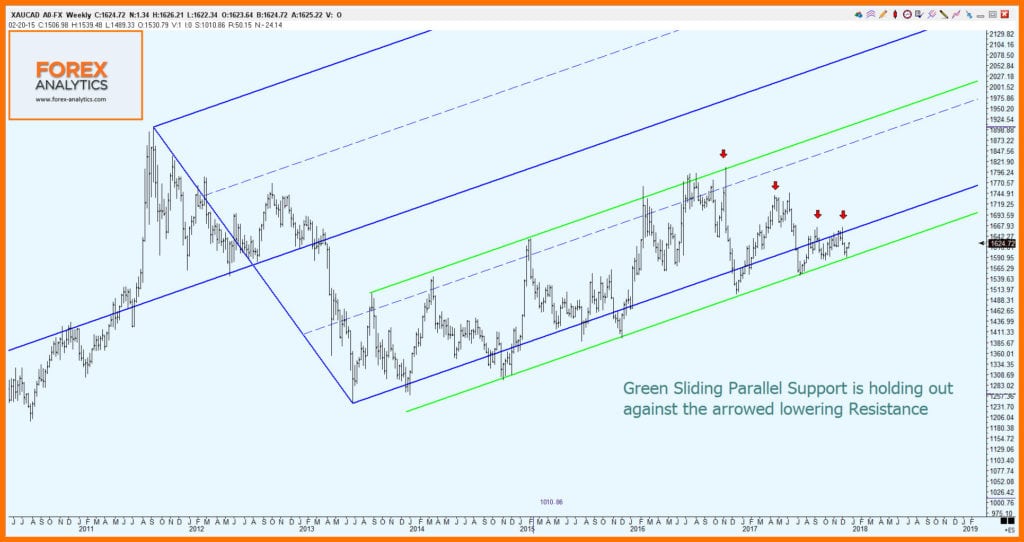
Or have a look at Chart 4 which again shows Gold on a Weekly basis, this time in Canadian Dollars. The superimposition of the pitchfork over price makes sense out of the moves – what is happening is discernible and it came as no surprise to see price rise recently from green Sliding Parallel Support at CAD$ 1596. I don’t know if you’re getting the feeling that we are finding Support for Gold in a number of currencies.
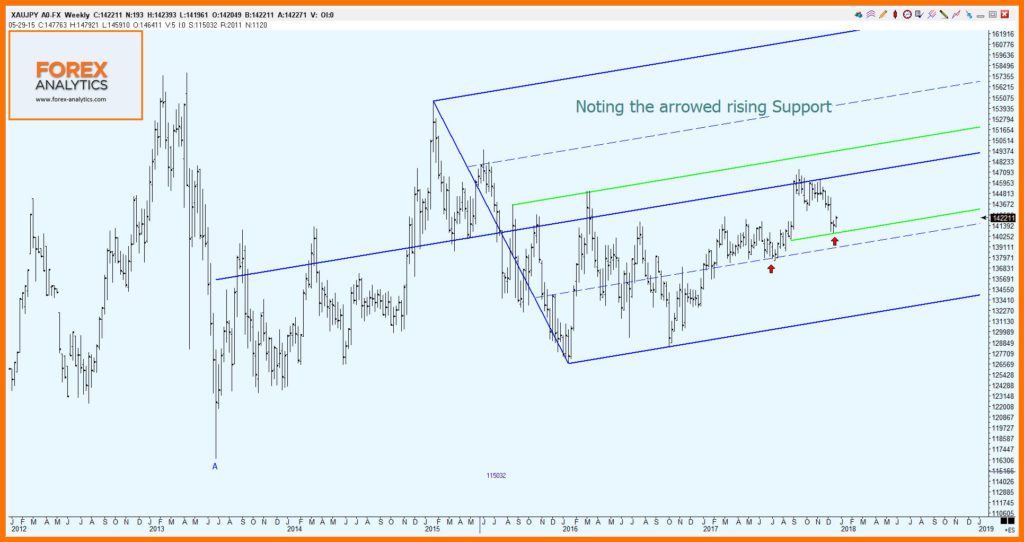
Chart 5 shows Gold in Japanese Yen and whilst, unlike other charts, we have not fallen to the Lower Parallel before finding Support, we have found it within the body of the fork. The green Sliding Parallel shows how Support has risen from the arrowed Quartile and, as any chart technician will tell you, rising Support is bullish and puts pressure on prior Resistance. Well we’re not at that stage yet in that Resistance is some way above, at the Median Line, but we are seeing a positive move in terms of Support…
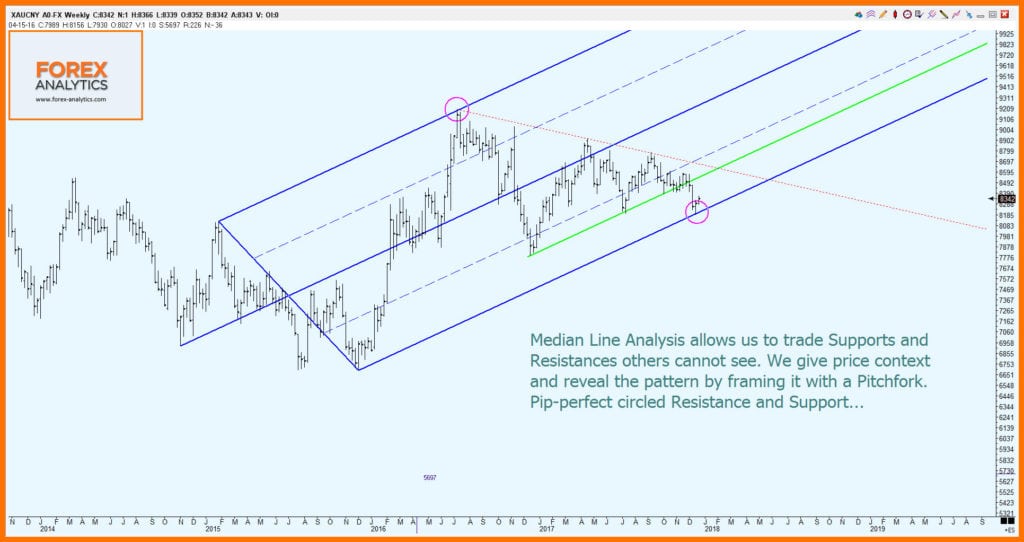
Finally let’s look at Chart 6 which shows the Weekly Gold price in Chinese Yuan. Anybody with an interest in Precious Metals will be aware of the importance of China’s market – they are both the world’s largest producer of Gold and the largest importer. Many people talk about the movement of physical Gold from West to East, so it is folly to ignore the price in terms of the Chinese currency. Again the pitchfork shows how price has acted and reacted perfectly along its lines. We have circled Resistance at 9200 at the Upper Parallel followed by a fall to Support along the green Sliding Parallel. When this gave way, price didn’t just freefall, but instead dipped to the anticipated Support at the Lower Parallel, from where it has now bounced. We will continue to monitor this chart and watch as price tries to build from this low.
I hope that I have briefly been able to show that 2018 should be a good year for the Precious Metals. Across a number of very important currencies we can see that price has moved to levels of Support – levels that we could anticipate with confidence due to the use of Median Line Analysis. Nothing is a “given” in the markets, but price has moved decisively away from these levels and we can say that as long as the recent lows hold, Gold looks set to continue to push higher.
Using Median Lines, not only can we anticipate high probability Supports and Resistances but we can also monitor the strengthening or weakening of trend as a move progresses. We cover Precious Metals in Dollars and other major currencies in our “Metals” service which provides members with Daily video analysis and a Traders’ Chatroom – we also cover Platinum, Palladium and a number of miners. Our principal “Markets” service not only includes Metals but also extensively covers Forex, Commodities and Indices again via Daily video analysis, Chatroom and twice weekly Webinars.
Please have a look at our website www.forex-analytics.com where you will find a Christmas Offer is in place – the first month of your membership is available for just $50. Additionally if you find that the Service is not right for you, let us know in the first fortnight and we will refund this membership in full.
If you would like to find out more about Median Lines please take the time to watch this recent live Webinar : https://vimeo.com/245978075
And if you’d like to attend our next Webinar in early January, please register here: https://attendee.gotowebinar.com/register/8469253682362834435