Here is the year end performance for the year. The first number is the close on December 31, 2013, second number is the close on December 31, 2014, and the third number is percentage change.
DOW: 16,539.58 vs. 17,823.07, up 7.8%
S&P 500:, 1,844.72 vs. 2,058.9, up 11.6%
US$ INDEX: 80.084 vs. 90.620, up 13.2%
GOLD: $1,201.90 vs. $1.183.90, down 1.5%
SILVER: $19.339 vs. $15.565 , down 19.5%
PLATINUM: $1,371.10 vs. $1,208.90, down 11.8%
PALLADIUM: $717.15 vs. $798.40, up 11.3%
This year was cleary a mixed bag for the precious metals. On the one hand, gold stabilized and confirmed its trading range which was formed after last year’s price crash. Another positive fact is the relative strength of the price of gold in most major currencies non-U.S. Dollar. On the other hand, silver and the miners went lower and broke below their trading range. That is clearly disinflationary, and disfinlation has been the main message that the precious metals complex has signaled in the past year. That is also the baseline for gold’s outlook for 2015.
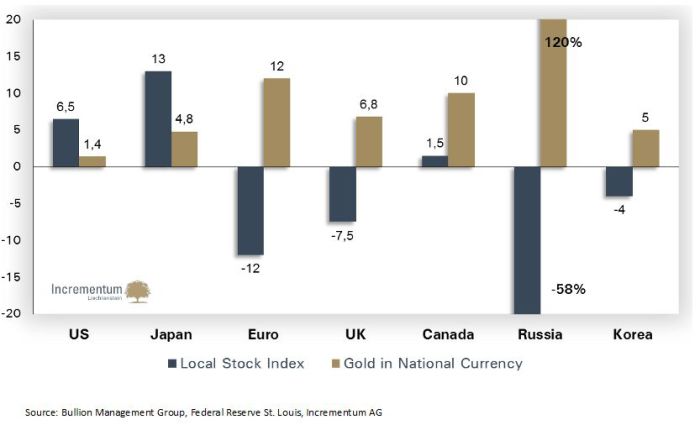
The constant outperformance of the U.S. stock market was the main theme in financial media. Similarly, gold’s weakness has been emphasized over and over again in 2014. That has undoubtedly created the perception that stocks have been a much better investment class than gold. Although that conclusion sounds intuitive to some, it is not supported by the facts as evidenced by the following chart.
The next chart compares gold with the stock market performance in 7 major regions or countries in 2014. It shows that only the U.S. and Japanese stock market outperformed gold in 2014. As an investment asset, holding gold in 2014 was not a bad idea at all.
Credit to Ronald Stoeferle for content.