The correction that started after January’s record high has been brutal — gold is down roughly 6-7% for the year and sitting near $4,050 an ounce. Silver has been hit far harder, down almost 25% and trading around $54, just a hair above its yearly low.
With the Fed meeting wrapping up today and a December rate hike still priced near 85% odds, oil-driven inflation fears are keeping a lid on the price.
Here’s the case that we may be close to a bottom: gold is only about 2% above its low of $3,942, silver just printed a bottoming tail on the daily chart holding near $52.70, and both metals are deeply oversold on the technicals.
Standard Chartered remains bullish, forecasting a fourth-quarter average near $4,650 to $4,850 by early twenty twenty-seven, and CPM Group’s Jeffrey Christian discussed support near $3,800 and why CPM is not convinced that gold will fall to $3,500.
The same structural story hasn’t changed — central banks are still accumulating, global money supply is still expanding, and every major currency is still being debased. Corrections this sharp, this oversold, with physical demand resilient, have historically marked opportunity. If you’ve been waiting for a better entry, this is about as close as it gets without catching a falling knife.
As always, don’t try to time the market. That’s exactly why dollar-cost averaging matters right now: fixed purchases at these levels lock in ounces at prices that may not be seen again for a long while instead of trying to guess the exact bottom. I would encourage you to not get greedy waiting for cheaper, and don’t get scared by the headlines. Owning real money against paper currency is prudent.
If you are contemplating selling – I would encourage you not to unless you truly need the funds for another purpose.
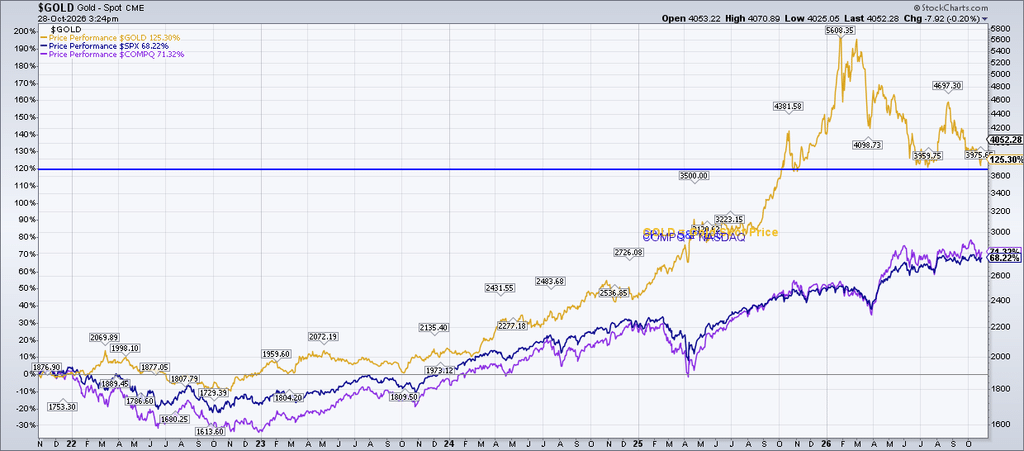
The gold price (gold) has outperformed the S&P (blue) and NASDAQ (purple) by almost 2x in the past 5 years
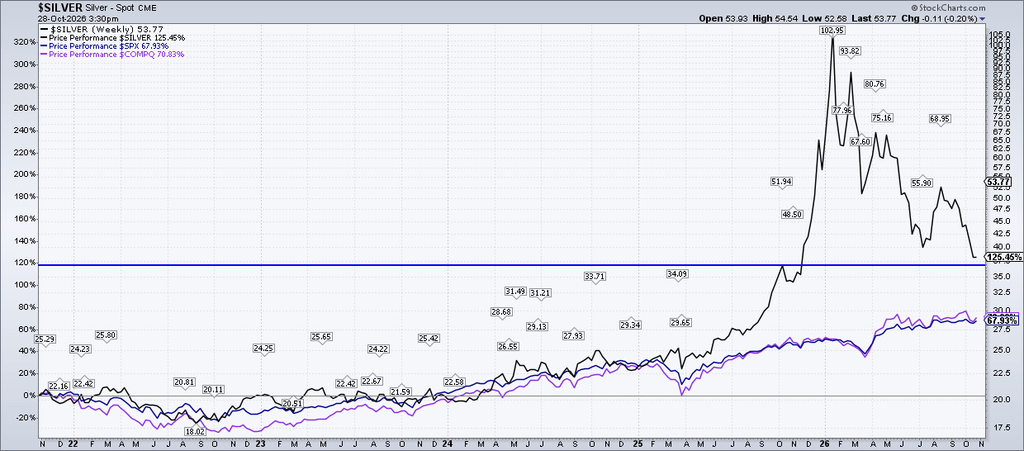
The silver price (black) is also almost double the S&P and NASDAQ in the past 5 years